Note
All regular expressions specified in this document follow the syntax described at Syntax.Introduction
This guide provides comprehensive information on configuring log collection and processing in OpsRamp. It covers supported features, log format components, configuration file locations, and advanced options for parsing and transforming logs.
Supported Functionality
- Inclusion and exclusion of log files
- Parsing logs using Regex and JSON
- Defining custom OTLP operators with custom formatting
- Filtering logs based on tags
- Scrubbing or redacting sensitive text
Components of a Log Format
In OpsRamp, all collected logs are structured into three main sections for efficient querying and organization:
- Log Resource Attributes: Metadata about the log source, such as host, file name, and file path.
- Log Record Attributes: User-defined attributes specific to individual log records. By default, this section is empty unless explicitly defined.
- Body: Contains the raw log line as collected, unless transformed by Regex or JSON parsers. Extracted fields can be mapped to record or resource attributes, which are then indexed in OpsRamp.
File Configurations
Configuration files define the behavior of log collection for the OpsRamp Agent on both Linux and Windows systems.
Linux File Configurations
- Default Location:
/opt/opsramp/agent/conf/log/log-config.yaml - User-Defined Config Location:
/opt/opsramp/agent/conf/log.d/log-config.yaml
Users should modify the user-defined configuration file at /opt/opsramp/agent/conf/log.d/log-config.yaml. If this file is not specified, the system defaults to collecting Syslog and Journal ID logs using the default configuration.
Windows File Configurations
- Default Location:
C:\Program Files (x86)\OpsRamp\Agent\conf\log\log-config.yaml - User-Defined Config Location:
C:\Program Files (x86)\OpsRamp\Agent\conf\log.d\log-config.yaml
Users should modify the user-defined configuration file. If no user-defined configuration is present, the default configuration is used, which collects application event error logs.
FAQ
What is the purpose of the Default Config file if only the User-Defined Config is required?
The default configuration is used alongside auto-detection of applications. If the agent detects an application, log collection is activated for those applications as well.How can detected applications be verified?
Detected applications are listed in/opt/opsramp/agent/conf/log.d/log-config.yaml.sample(Linux) andC:\Program Files (x86)\OpsRamp\Agent\conf\log.d\log-config.yaml.sample(Windows). This file updates with each auto-detection event.
Note
- All configuration changes must be made in the user-defined config file.
- If a user-defined config exists, the default config is ignored.
- Auto-discovery of applications is disabled when using a user-defined config.
Simple File Log Collection
A simple log file typically contains plain text log messages. You can configure OpsRamp to collect these logs and send them directly to the portal using Regex or JSON parsing. Consider the following limitations:
- Timestamps are based on collection time, not generation time.
- Log levels are determined by basic string matching, which may be unreliable if multiple log-level substrings exist in a line.
- Timestamp parsing and severity mapping fields are ignored in this mode.
inputs:
  source_name:
    type: file
    source: ''
    include:
      - /var/log/application_name/log_name.log
    exclude:
      - ''
    fingerprint_size: 1000
File Log Collection Using Regex
Regex-based log collection extracts structured data from log files using predefined patterns. For example, to parse Nginx logs:
inputs:
nginx_access:
type: file
source: nginx_access
include:
- /var/log/nginx/access.log
exclude:
- ''
parser_type: regex
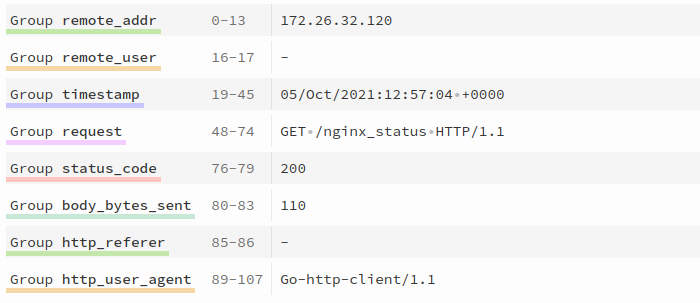
regex: ^(?P<remote_addr>[^\s]*)\s-\s(?P<remote_user>[^\s]*)\s\[(?P<timestamp>[^]]*)]\s*"(?P<request>[^"]*)"\s*(?P<status_code>\d*)\s*(?P<body_bytes_sent>\d*)\s*"(?P<http_referer>[^"]*)"\s*"(?P<http_user_agent>[^"]*)"$
timestamp:
layout_type: strptime
layout: '%d/%b/%Y:%H:%M:%S %z'
location: UTC
Here, the Regex parser is specified, and a valid regular expression is provided to match the Nginx log format. You can validate your regex using tools like REGEX 101.
Sample Nginx logs:
172.26.32.120 - - [05/Oct/2021:12:57:04 +0000] "GET /nginx_status HTTP/1.1" 200 110 "-" "Go-http-client/1.1"
172.26.32.120 - - [05/Oct/2021:12:58:04 +0000] "GET /nginx_health HTTP/1.1" 200 110 "-" "Go-http-client/1.1"
172.26.32.120 - - [05/Oct/2021:12:59:04 +0000] "GET /nginx_info HTTP/1.1" 200 110 "-" "Go-http-client/1.1"
172.26.32.120 - - [05/Oct/2021:13:00:04 +0000] "GET /nginx_status HTTP/1.1" 200 110 "-" "Go-http-client/1.1"
Regex used:
^(?P<remote_addr>[^\s]*)\s-\s(?P<remote_user>[^\s]*)\s\[(?P<timestamp>[^]]*)]\s*"(?P<request>[^"]*)"\s*(?P<status_code>\d*)\s*(?P<body_bytes_sent>\d*)\s*"(?P<http_referer>[^"]*)"\s*"(?P<http_user_agent>[^"]*)"$
Fields enclosed in (?P<group_name>regex_expression) are extracted and can be further customized using advanced configurations such as custom formatting, filtering, and scrubbing. These topics are covered in the Advanced Configurations section.
The timestamp field allows you to synchronize the log’s timestamp in OpsRamp with its original generation time. Supported formats include strptime, gotime, and epoch. See Supported Timestamp Formats for details.
File Log Collection Using JSON
You can extract structured information from JSON-formatted log files.
log-config.yaml:
eventstore:
    type: "file"
    source: "eventstore"
    include:
      - /var/log/eventstore/**/*.json
    parser_type: "json"
    custom_formatting: |-
      [
        {
          "type":"move",
          "from": "body.[\"@t\"]",
          "to":"body.timestamp"
        }
      ]
    timestamp:
      layout_type: strptime
      layout: "%Y-%m-%dT%H:%M:%S.%s%z"
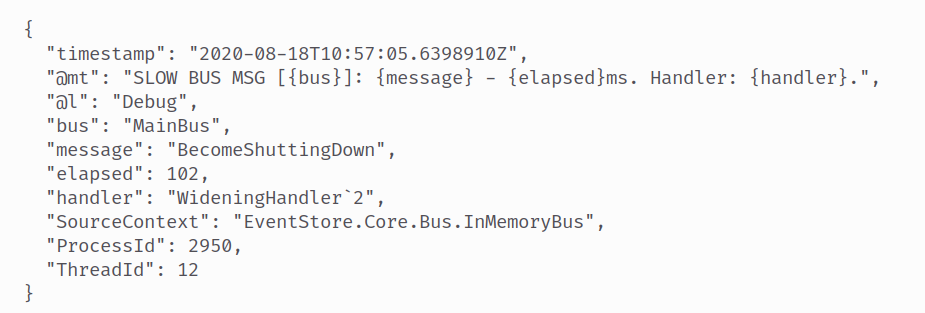
This configuration parses EventStore logs in JSON format. The custom_formatting field renames the @t key to timestamp for proper timestamp parsing.
Sample eventstore log:
{"@t":"2020-08-18T10:57:05.6398910Z","@mt":"SLOW BUS MSG [{bus}]: {message} - {elapsed}ms. Handler: {handler}.","@l":"Debug","bus":"MainBus","message":"BecomeShuttingDown","elapsed":102,"handler":"WideningHandler`2","SourceContext":"EventStore.Core.Bus.InMemoryBus","ProcessId":2950,"ThreadId":12}
{"@t":"2020-08-18T10:57:05.6560627Z","@mt":"SLOW QUEUE MSG [{queue}]: {message} - {elapsed}ms. Q: {prevQueueCount}/{curQueueCount}.","@l":"Debug","queue":"MainQueue","message":"RequestShutdown","elapsed":124,"prevQueueCount":0,"curQueueCount":8,"SourceContext":"EventStore.Core.Bus.QueuedHandlerMRES","ProcessId":2950,"ThreadId":12}
{"@t":"2020-08-18T10:57:05.6623165Z","@mt":"========== [{httpEndPoint}] Service '{service}' has shut down.","httpEndPoint":"127.0.0.1:1113","service":"StorageWriter","SourceContext":"EventStore.Core.Services.VNode.ClusterVNodeController","ProcessId":2950,"ThreadId":12}
After parsing, the @t key is renamed to timestamp, enabling accurate timestamp extraction.
Note
If logs are not parsed as JSON, not all fields will be extracted, which may result in incomplete information and improper display in the UI.Advanced Configurations
Multiline Configuration
Multiline configuration enables handling of log entries that span multiple lines. The multiline block instructs the file source to split log entries based on a pattern other than newlines. It must contain exactly one of either line_start_pattern or line_end_pattern, which are regex patterns matching the start or end of a log entry.
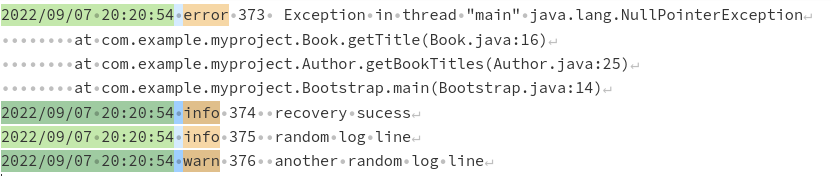
Sample logs:
2022/09/07 20:20:54 error 373  Exception in thread "main"
java.lang.NullPointerException
        at com.example.myproject.Book.getTitle(Book.java:16)
        at com.example.myproject.Author.getBookTitles(Author.java:25)
        at com.example.myproject.Bootstrap.main(Bootstrap.java:14)
2022/09/07 20:20:54 info 374  recovery sucess
2022/09/07 20:20:54 info 375  random log line
2022/09/07 20:20:54 warn 376  another random log line
Configuration:
log-config.yaml
inputs:
  application:
    type: file
    include:
      - "/var/log/application/*.log"
    parser_type: "regex"
    multiline:
      line_start_pattern: ^(?P<timestamp>\d{4}\/\d{2}\/\d{2}\s*\d{2}:\d{2}:\d{2})\s*(?P<level>\w*)
The collector treats everything from the matched pattern until the next match as a single log entry.
Severity From
The severity_from field specifies the source from which the severity level of log entries is derived.
Example:
redis:
    type: "file"
    source: "redis"
    include:
      - /home/lokesh/experiments/otel_collector/test_otel_collector_integration/redis-server-tampered.log
    multiline:
      line_start_pattern: ^(?P<pid>\w*):(?P<role>\w*)\s*(?P<timestamp>\d*\s*\w*\s*\d*\s*\d*:\d*:\d*.\d*)
    parser_type: "regex"
    regex: ^(?P<pid>\w*):(?P<role>\w*)\s*(?P<timestamp>\d*\s*\w*\s*\d*\s*\d*:\d*:\d*.\d*)\s*(?P<level>\W)(?P<message>.*)$
    timestamp:
      layout_type: strptime
      layout: "%e %b %H:%M:%S.%f"
    severity_from: "body.lvl"
Severity Mapping
Severity mapping correlates log entry severity levels to standardized values for better organization and analysis.
Sample Redis logs:
18842:M 27 Jun 10:55:21.636 * DB saved on disk
18842:M 27 Jun 10:55:21.636 * Removing the pid file.
18842:M 27 Jun 10:55:21.637 # Redis is now ready to exit, bye bye...
24187:C 27 Jun 10:55:21.786 # oO0OoO0OoO0Oo Redis is starting oO0OoO0OoO0Oo
Configuration:
redis:
    type: "file"
    source: "redis"
    include:
      - /home/lokesh/experiments/otel_collector/test_otel_collector_integration/redis-server-tampered.log
    multiline:
      line_start_pattern: ^(?P<pid>\w*):(?P<role>\w*)\s*(?P<timestamp>\d*\s*\w*\s*\d*\s*\d*:\d*:\d*.\d*)
    parser_type: "regex"
    regex: ^(?P<pid>\w*):(?P<role>\w*)\s*(?P<timestamp>\d*\s*\w*\s*\d*\s*\d*:\d*:\d*.\d*)\s*(?P<level>\W)(?P<message>.*)$
    timestamp:
      layout_type: strptime
      layout: "%e %b %H:%M:%S.%f"
    severity_priority_order: [ "error", "fatal", "warn", "info", "debug", "trace" ]
    severity_mapping:
      warn: [ "#" ]
      info: [ "*" ]
      debug: [ "." ]
      trace: [ "-" ]
      error: []
      fatal: []
Mapping:
#→ WARN*→ INFO.→ DEBUG-→ TRACE
If the severity mapping is empty, it is ignored. The mapped severity is displayed as a log attribute named “Custom Severity”.
Encoding
Encoding specifies the character encoding used in log files. This is important when logs are not in standard UTF-8 encoding.
application_name:
    type: "file"
    source: "application_name"
    encoding: "utf-8"
    include:
      - /var/log/applicaton/*.log
Supported encoding types
| Key | Description |
|---|---|
nop | No encoding validation; treats file as raw bytes |
utf-8 | UTF-8 encoding |
utf-16le | UTF-16 encoding, little-endian |
utf-16be | UTF-16 encoding, big-endian |
ascii | ASCII encoding |
big5 | Big5 Chinese character encoding |
User-Defined Constant Labels
You can assign up to five custom resource labels to log entries. If more than five are specified, only the first five are used.
application:
    type: "file"
    include:
      - /var/log/application/*.log
    labels:
      label_key_1: "label_value_1"
      label_key_2: "label_value_2"
      label_key_3: "label_value_3"
Setting ParseTo
The parse_to field specifies where parsed log fields are stored. Use this option with caution, as it may affect level and timestamp parsing.
Possible destinations:
- body: Store parsed results in the log entry body.
- attributes: Store as log record attributes.
- resource: Store as resource attributes.
application:
    type: "file"
    include:
      - /var/log/application/*.log
    parser_type: "regex"
    regex: ^(?P<pid>\w*):(?P<role>\w*)\s*(?P<timestamp>\d*\s*\w*\s*\d*\s*\d*:\d*:\d*.\d*)\s*(?P<level>\W)(?P<message>.*)$
    parse_to: "body"
    timestamp:
      layout_type: strptime
      layout: "%e %b %H:%M:%S.%f"
Set Values
You can assign parsed fields as record or resource attributes for indexing and querying in OpsRamp.
application:
    type: "file"
    include:
      - /var/log/application/*.log
    parser_type: "regex"
    regex: ^(?P<pid>\w*):(?P<role>\w*)\s*(?P<timestamp>\d*\s*\w*\s*\d*\s*\d*:\d*:\d*.\d*)\s*(?P<level>\W)(?P<message>.*)$
    timestamp:
      layout_type: strptime
      layout: "%e %b %H:%M:%S.%f"
    attributes: [ "role", "pid" ]
    resource_attributes: [ "role" ]
In this example, role and pid are set as record attributes, and role is also set as a resource attribute. All attributes and resource attributes are indexed in OpsRamp.
Custom Formatting
Custom formatting provides full control over the parsing process, allowing you to tailor log entries as needed. The custom_formatting field accepts a list of operators for extracting and transforming information.
For more details, refer to the OpenTelemetry collector operators documentation.
Filter Logs
Filtering logs allows you to select specific log entries from a larger dataset based on defined criteria. To filter logs, define rules in the filters section for each input source.
Filtering Syntax:
filters:
  - key: ""
    include: ""
  - key: ""
    exclude: ""
  - attribute_type: "resource"
    key: ""
    include: ""
  # Additional filter rules as needed
| Tag Name | Description |
|---|---|
| exclude | Excludes records that match the specified regular expression pattern. |
| include | Includes records that match the specified regular expression pattern. |
| key | The field or label to which the filter rule applies. |
| attribute_type | Specifies where to apply the filter: body, attributes, or resource. Defaults to body if omitted. |
Each filter rule must specify either include or exclude, but not both. If you need to apply both inclusion and exclusion logic, create separate filter rules and chain them in the desired order. Filtering is performed sequentially, following the order of the rules.
If attribute_type is set to body and key is left empty, filtering is applied directly to the raw log body. Use this approach only if no regex or JSON parser is applied, as it may cause errors if the body is not a plain string.
Note
Applying filters directly to the body may result in errors if the body is not a raw string.Windows Event Log Filtering Example
The following examples demonstrate how to filter Windows Event Logs at the source.
Basic Windows Event Log Configuration
applicationevent:
  type: windowseventlog
  channel: application
  start_at: end
Explanation:
applicationevent: Name of the configuration section.type: Specifies the input type. Usewindowseventlogfor Windows event logs.channel: The Windows event channel to collect logs from (e.g.,application,security,system).start_at: Determines where to start collecting logs:end: Collects events generated after the log management module starts.beginning: Collects events from the last 2 hours prior to startup.
To collect events from multiple channels, define multiple configurations:
applicationevent:
  type: windowseventlog
  channel: application
  start_at: end
securityevent:
  type: windowseventlog
  channel: security
  start_at: end
Filtering Windows Events by Level
To filter events based on their level in the system channel:
systemevent:
  type: windowseventlog
  channel: system
  start_at: end
  filters:
    - attribute_type: attributes
      key: level
      include: "(?i)Error|Warn*"
This configuration ensures that only events with levels Error, Critical, or Warning are sent to OpsRamp. Informational events are excluded.
Filtering Configuration Details:
attribute_type: Specifies where to apply the filter (attributes,resource, orbody). Defaults tobody.key: The field or label to filter on, based on the specifiedattribute_type.include/exclude: Regular expression to match values to include or exclude. Only one should be specified per rule.
Invalid Example (do not use both include and exclude in the same rule):
systemevent:
  type: windowseventlog
  channel: system
  start_at: end
  filters:
    - attribute_type: attributes
      key: level
      include: "(?i)Error|Warn*"
      exclude: "Info"
Note: The OpsRamp Agent maps Windows event levels as follows:
Information,Verbose→infoWarning→warnError,Critical→error
Filtering by Event Identifier
To exclude specific event identifiers:
systemevent:
  type: windowseventlog
  channel: system
  start_at: end
  filters:
    - attribute_type: attributes
      key: event_identifier
      exclude: "4672|10016"
This configuration excludes events with identifiers 4672 and 10016.
Combining Multiple Filters (AND Logic)
You can chain multiple filters to apply AND logic:
systemevent:
  type: windowseventlog
  channel: system
  start_at: end
  filters:
    - attribute_type: attributes
      key: event_identifier
      exclude: "4672|10016"
    - attribute_type: attributes
      key: level
      include: "(?i)Error|Warn*"
This configuration exports only events from the system channel that have levels error, critical, or warning, and do not have event identifiers 4672 or 10016.
You can apply similar filtering logic to other channels as needed.
Masking/Scrubbing Logs
Masking or scrubbing logs involves obscuring sensitive or personally identifiable information (PII) found within log entries. This practice aims to safeguard privacy and maintain compliance with data protection regulations. To mask any sensitive data present in the logs, you must define masking rules within the masking section corresponding to their respective log inputs.
Masking Syntax:
masking:
  - text: ""
    placeholder: ""
  - text: ""
    placeholder: ""
| Tag Name | Description |
|---|---|
| text | Regular Expression for the text that needs to be masked. |
| placeholder | String which will be used for replacing the text specified. |
Multiple Regexes for Single Source
Note
This functionality can only be accessed with agent versions equal to or greater than 17.1.0.The Multiple Regexes for Single Source refers to the use of multiple regular expressions (regexes) to parse and extract information from log files. In cases where a log file contains entries with multiple formats, you can utilize the following configuration:
inputs:
  source_name:
    type: file
    include:
      - /var/log/file1.log
      - /var/log/file2.log
    multiline:
      line_start_pattern: ""
    parser_type: "regex"
    multi_regex: # specify as many regex expression as required (only works when parser_type is regex)
      - regex: '^(?P<timestamp>\d{4}-\d{2}-\d{2}) (?P<level>[A-Z]*) (?P<message>.*)$'
        timestamp:
          layout_type: strptime
          layout: "%b %e %H:%M:%S"
        severity_from: "body.lvl"
        severity_priority_order:
          ["error", "fatal", "warn", "info", "debug", "trace"]
        severity_mapping:
          warn: ["#"]
          info: ["*"]
          debug: []
          trace: []
          error: []
          fatal: []
        filters:
          - attribute_type: "body"
            key: ""
            include: ""
          - key: ""
            exclude: ""
        masking:
          - text: ""
            placeholder: ""
        attributes: []
        resource_attributes: []
        custom_formatting: |-
          [
            {
              "type": "copy",
              "from": "body.message",
              "to": "body.duplicate"
            }
          ]
      - regex: '^(?P<timestamp>\d{4}-\d{2}-\d{2}) (?P<message>.*)$'
Point to remember:
- Ensure that the multiple line start, or end pattern is configured to match all the regex patterns defined for the source, given that log line splitting occurs before regex matching.
- All the specified regex patterns are compared in the order in which they are defined, and the first one that matches is considered, with all subsequent patterns being ignored.
Additional File Type Settings
Fingerprint Size
The parameter fingerprint_size determines the number of bytes used from the beginning of a file to uniquely identify it across polls. Since this is the only criterion for identifying file uniqueness, it is essential to adjust this value if the initial 1000 bytes of multiple files are identical.
inputs:
  source_name:
    type: "file"
    include:
      - "/var/log/application_name/log_name.log"
    #########################################################################################################
   # Fingerprint Size
    #########################################################################################################
    fingerprint_size: 1000
    #########################################################################################################
Poll and Flush intervals
Poll and flush intervals dictate how frequently data is collected and transmitted in systems.
- Poll Interval: This refers to the frequency at which a system retrieves or collects data from a source.
- Flush Interval: This determines how often collected data is transmitted or flushed to its destination.
For example,
- poll_interval: It is the duration to check log files for new changes.
- force_flush_period: Determines the period elapsed since the last data read from a file. Once this interval is completed, the currently buffered log will be forwarded to the pipeline for processing. A setting of 0 disables forced flushing, a configuration usually not necessary in the majority of cases.
inputs:
  source_name:
    type: "file"
    include:
      - "/var/log/application_name/log_name.log"
    #########################################################################################################
    # Poll and Flush Settings
    #########################################################################################################
    poll_interval: 200ms
    force_flush_period: 500ms
    #########################################################################################################
Retry on Failure
The Retry on Failure refers to the capability of log collection systems to automatically retry sending log data to a central repository or processing pipeline when a failure occurs during the initial attempt.
inputs:
  source_name:
    type: "file"
    include:
      - "/var/log/application_name/log_name.log"
    #########################################################################################################
    # Retry On failure Settings
    #########################################################################################################
    retry_on_failure:
      enabled: false
      initial_interval: 1s
      max_interval: 30s
      max_elapsed_time: 5m
    #########################################################################################################
Max Concurrent Files
When processing logs, the agent restricts the maximum number of files it can open at any given point in time. This setting determines that value on a per-source basis, with a default of 5 files. It is advisable to proceed with caution when considering increasing this number.
inputs:
 source_name:
    type: "file"
    include:
      - "/var/log/application_name/log_name.log"
    #########################################################################################################
    # Max Concurrent Files Settings
    #########################################################################################################
max_concurrent_files: 5
#########################################################################################################
Refresh Interval
This configuration parameter specifies the interval at which the list of files is updated for the specified paths to monitor in the include configuration.
inputs:
  source_name:
    type: "file"
    include:
      - "/var/log/application_name/log_name.log"
    #########################################################################################################
    # Refresh Interval
    #########################################################################################################
    refresh_interval: 60s
    #########################################################################################################
Ordering Criteria
The agent selectively collects a limited number of files based on their modified time, adhering to a predetermined upper limit.
inputs:
  source_name:
    type: "file"
    include:
      - "/var/log/application_name/log_name.log"
    #########################################################################################################
    # Ordering Criteria
     ##########################################################################################################
ordering_criteria:
      top_n: 5
      max_time: 2h
    #########################################################################################################
Note
Starting from agent version 17.1.0-1 and above, the agent automatically sets ordering criteria for all files by default.type: file, it defaults to: ordering_criteria:
top_n: 5
max_time: 2h
In the case of Kubernetes and Docker, these limits are set to:
ordering_criteria:
  top_n: 500
  max_time: 2h
To understand the function of these settings, let us examine the following example:
Suppose we have an application that generates logs in the directory /var/log/application/*.log, we utilize the following configuration to collect the logs from that path:
inputs:
  application:
    type: "file"
    include:
      - "/var/log/application/*.log
-rw-r--r--  1 root  wheel  0 Apr 14 16:35 file_1.log
-rw-r--r--  1 root  wheel  0 Apr 14 16:45 file_2.log
-rw-r--r--  1 root  wheel  0 Apr 14 16:55 file_3.log
-rw-r--r--  1 root  wheel  0 Apr 14 17:05 file_4.log
-rw-r--r--  1 root  wheel  0 Apr 14 17:15 file_5.log
-rw-r--r--  1 root  wheel  0 Apr 14 17:25 file_6.log
-rw-r--r--  1 root  wheel  0 Apr 14 17:35 file_7.log
-rw-r--r--  1 root  wheel  0 Apr 14 18:00 file_8.log
-rw-r--r--  1 root  wheel  0 Apr 14 18:30 file_9.log
-rw-r--r--  1 root  wheel  0 Apr 14 19:36 file_10.log
Case 1: If the present time is 20:00The agent will only watch the following files:
- file_10.log
- file_9.log
- file_8.logThis is because the max_time is set to 2hr by default and any file that has a modified time that is older than 2hr is ignored.
Case 2: If the present time is 19:40The agent will only watch the following files:
- file_10.log
- file_9.log
- file_8.log
- file_7.log
- file_6.logHere, the other logs which are still under 2 hrs ignored since we hit the top_n limit of 5 by default.These defaults ensure that the agent does not try to watch historic files which never get updated and are only used for bookkeeping. Setting these values to a high number is usually not advised since it comes with a performance penalty.