Introduction
The Path Analysis feature in Network Topology Management is a powerful tool that provides detailed insights into the network paths between specified source and destination endpoints. By leveraging this feature, you can visualize and analyze the routes taken by data packets across the network, identifying potential bottlenecks and other performance-related concerns.
Key Benefits of Path Analysis:
- Visual Representation: Provides a graphical representation of the network path, making it easier to understand the data flow and identify key network components involved in the communication.
- Detailed Resource Information: View comprehensive details about each resource along the path, including device names, IP addresses, connection status, and performance metrics.
- Performance Monitoring: Allows for real-time health monitoring of network resources.
- Troubleshooting: By analyzing the network path, administrators can quickly identify and address problems such as network congestion, faulty devices, or misconfigurations.
- Historical Data: Stores and displays historical data of previous runs, enabling users to compare current and past network performance.
Access the Features
Navigate to the Infrastructure > Network Topology section.
Locate and click the hamburger icon ☰ found in the top left corner of the interface.The MY TOPOLOGY VIEWS panel is displayed.
On the MY TOPOLOGY VIEWS panel, under the QUICK LINKS, you will see options for Path Analysis and Endpoints features.

Add Endpoints
Before you can perform a path analysis, you need to add the source and destination endpoints.
To add an endpoint:
Select Endpoints under QUICK LINKS.The ENDPOINTS page shows a list of previously added endpoints used for path analysis.

You can either use the existing endpoints or add new endpoints.
To add a source/destination endpoint, click +ADD.The ADD ENDPOINT page is displayed.

On the ADD ENDPOINT page, enter the below information:
- Name: Name for the endpoint.
- IP Address: Enter the source/destination IP address.
- Router: Select the router connected to the endpoint.
- Layer 2 checkbox (Optional):
- If the endpoint is connected via a Layer 2 switch, check the Layer 2 checkbox.
- Provide additional switch-related information as prompted
Click Add to register the source/destination endpoint.You can also use the search icon to search for the endpoints.
Perform Path Analysis
Once you have added the source and destination endpoints, you can proceed to perform the path analysis.
To perform path analysis:
Return to the hamburger menu ☰.
Select Path Analysis under the QUICK LINKS section.The PATH ANALYSIS page is displayed.

On the PATH ANALYSIS page, you will see a list of previously run path analysis results. You can also add a new run.
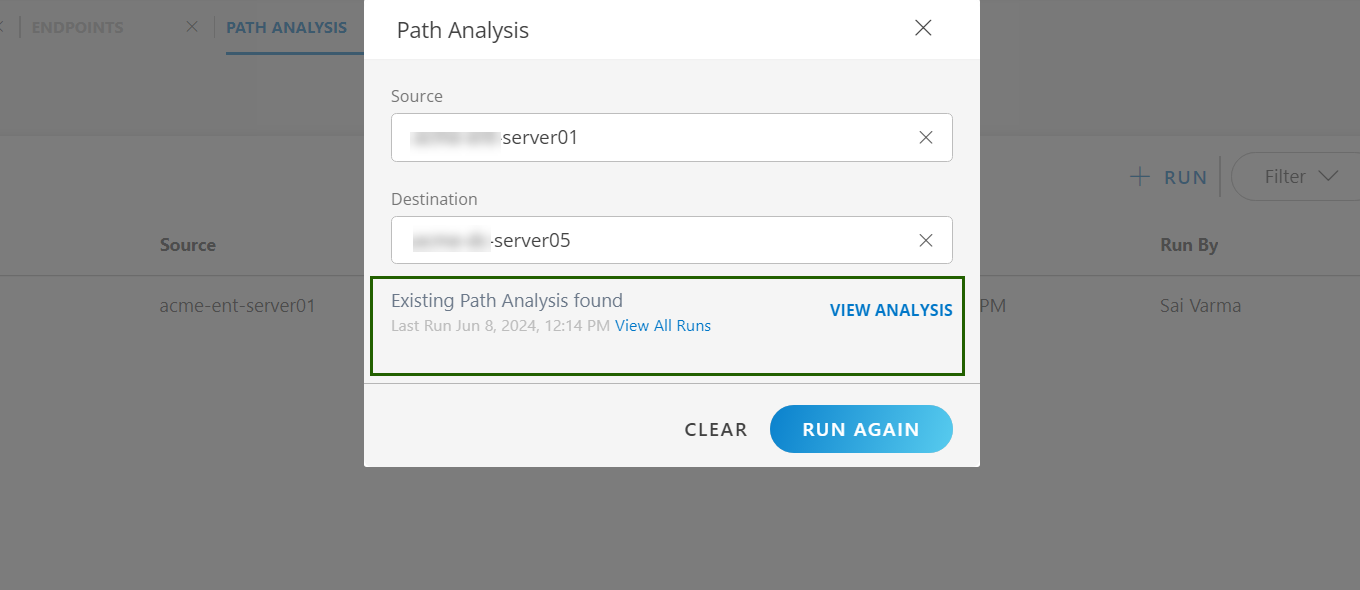
To add a new run, click +RUN.The Path Analysis page is displayed.
Choose the source endpoint from the list of available endpoints.
Choose the destination endpoint from the list of available endpoints.
Note
You can also add endpoints while selecting the endpoints.
After selecting both endpoints, click RUN.The system will generate a detailed path analysis report.
If previously conducted path analysis runs are available for the selected source and destination endpoints, you have the option to view all past runs by clicking View All Runs.
View the results
Once the analysis is complete, you will be presented with a report detailing the network path between the source and destination endpoints.
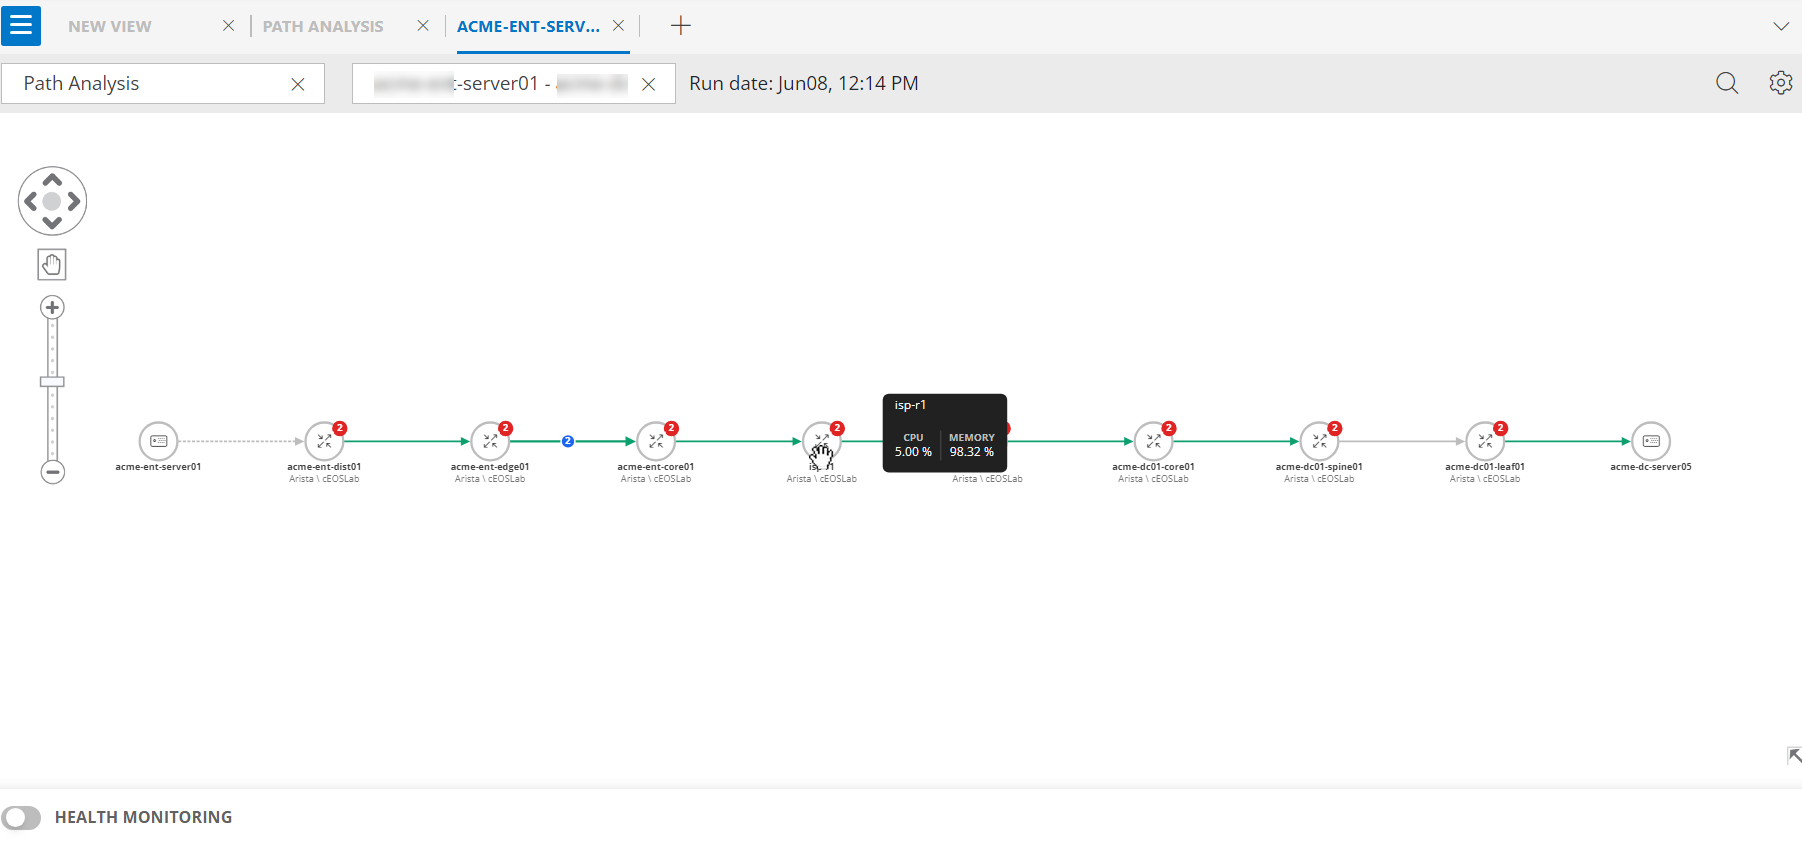
Use the information provided in the report to understand the network path and identify any issues or areas for improvement.
View detailed information
View resource information
On the Path Analysis page, click any resource in the network path.
A side panel will be displayed, providing detailed information about the selected resource.

The side panel includes:
- Overview: General information about the resource.
- Related Resources: Details of resources related to the selected resource.
- Custom Attributes: Any custom attributes assigned to the resource.
- Alerts: Information about any alerts related to the resource.
- View Details: Select this option to view more detailed information about the resource.
- View Topology: Select this option to see the resource within the broader network topology.
Perform actions on resources
In the side panel, click the Actions button to see a list of available actions for the resource. The available actions are:
Assign Credential: Assign or update the credentials for the resource.
Assign Custom Attribute: Add or update custom attributes for the resource.
Schedule Maintenance: Schedule maintenance tasks for the resource.
Launch Remote Session: Start a remote session to access and manage the resource.
Add Note: Add notes or comments related to the resource.
Unmanage: Mark the resource as unmanaged if it is no longer being monitored or managed.

View link and port channel information
On the Path Analysis page, click on any link in the network path.
A side panel will be displayed, providing detailed information about the selected link.

Also double-click on the port channel in the network path to view the detailed information.

Additional features
- On the Path Analysis results page, find the search icon.
- Enter the name or identifier of the resource you are looking for. The results will filter dynamically based on your input, allowing you to find specific resources within the path analysis results quickly.
- Click the settings icon and you will see options to view the topology in different layers:
Layer 1: Select this option to view the physical layer topology, showing the actual physical connections between devices.

Layer 3: Select this option to view the network layer topology, focusing on the logical connections and IP routing between devices.

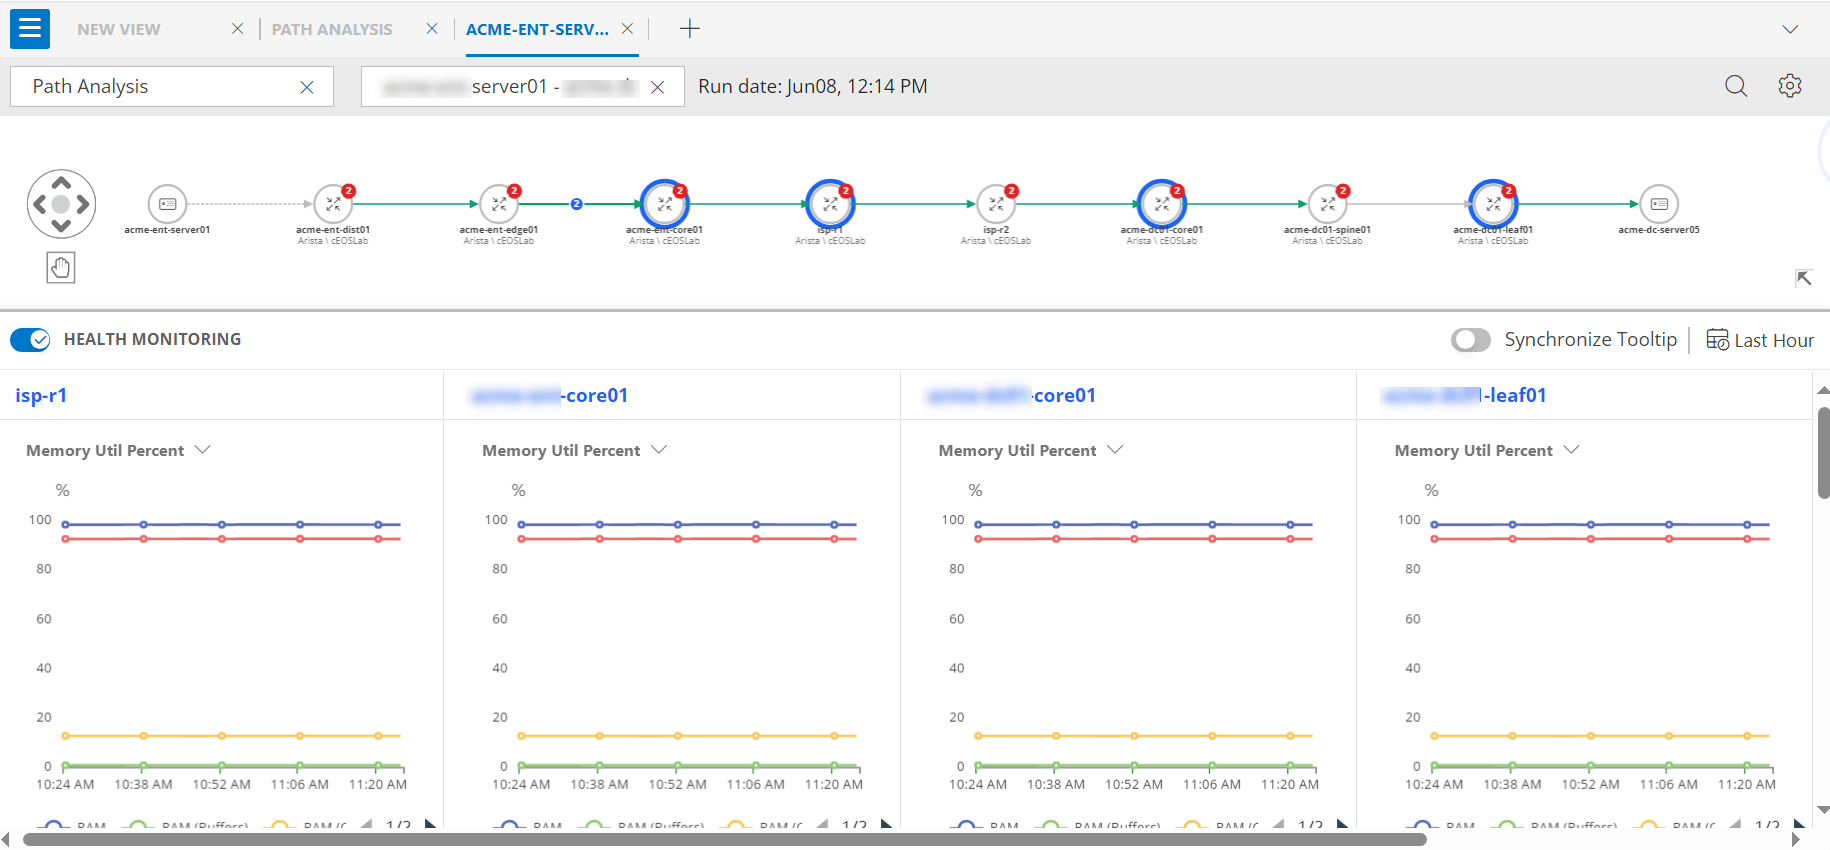
Health Monitoring
While viewing the analysis, you can perform health monitoring to check the status of each resource and link. See Health Monitoring for more details on how to monitor health on resources and links.
Manage Path Analysis Results
Once the path analysis is run, you can manage the results using the options available in the three-dot icon menu.
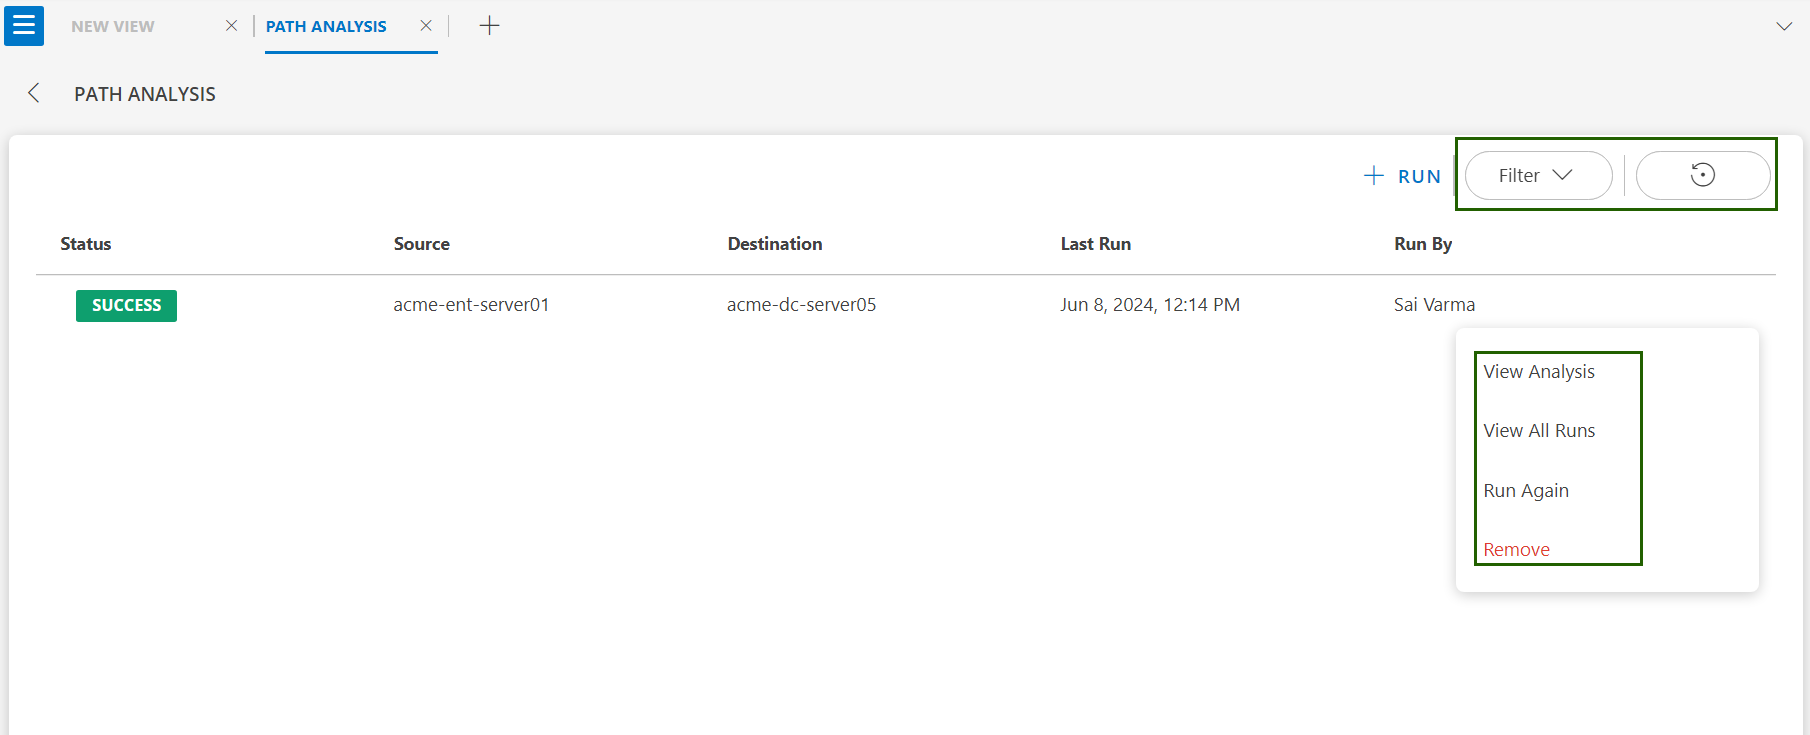
- On the Path Analysis page, find the analysis entry for the run you want to manage.
- On the extreme right, adjacent to the information, click the three-dot icon ⋮ to open the options menu. The available options are:
View Analysis: Select this option to view the detailed results of the path analysis.
View All Runs: Select this option to see a list of all path analysis runs.

Run Again: Select this option to rerun the path analysis with the same source and destination.
Remove: Select this option to delete the path analysis run from the list.
- You can filter the data using the FILTER option based on source, destination, or status details.
- Click the refresh icon. The page will reload the path analysis data, ensuring you have the most up-to-date information.